01
Integrated reading
Combine multiple indicators at grid-cell level.
A complete solution for prioritizing cycling investments.
VELODIT turns territorial data into readable priorities for technical teams, elected officials and public partners. It combines needs, network continuity and road safety at a fine spatial scale to support investment decisions.
The map is built layer by layer: residents’ needs, network continuity, road safety, then an integrated priority view. The animation shows the core value of VELODIT: a visible, ranked and discussable decision.
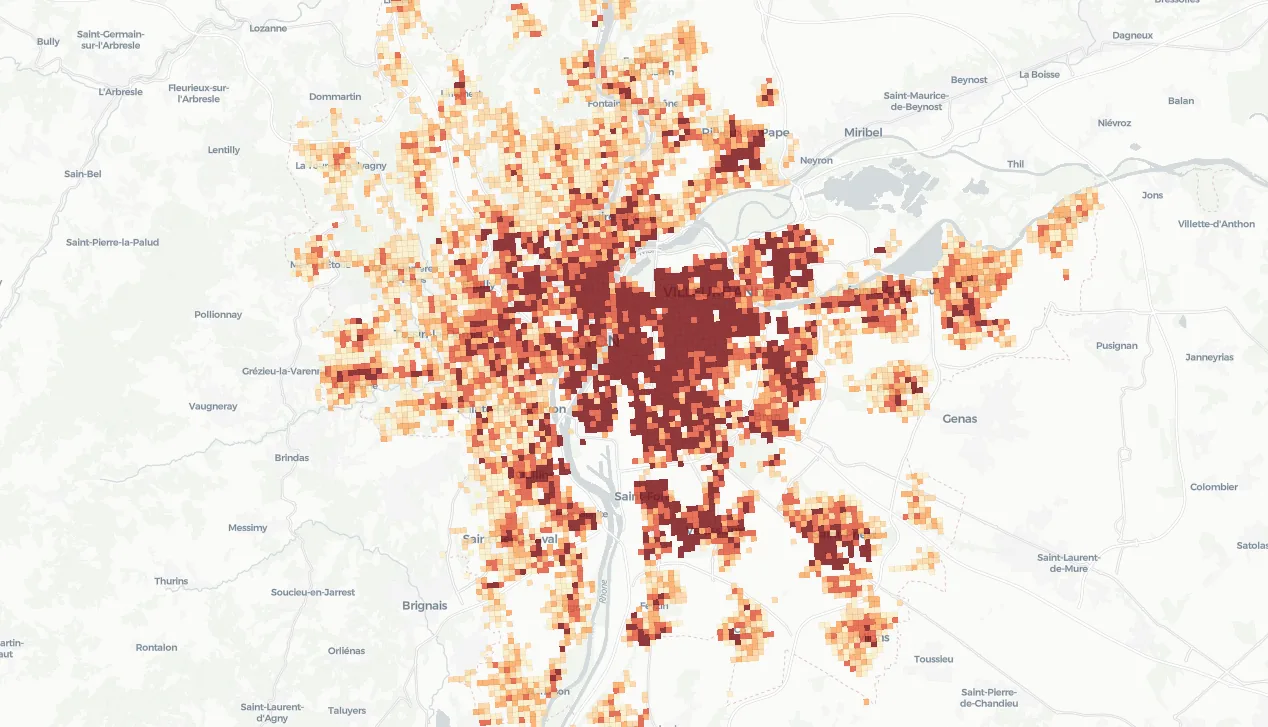
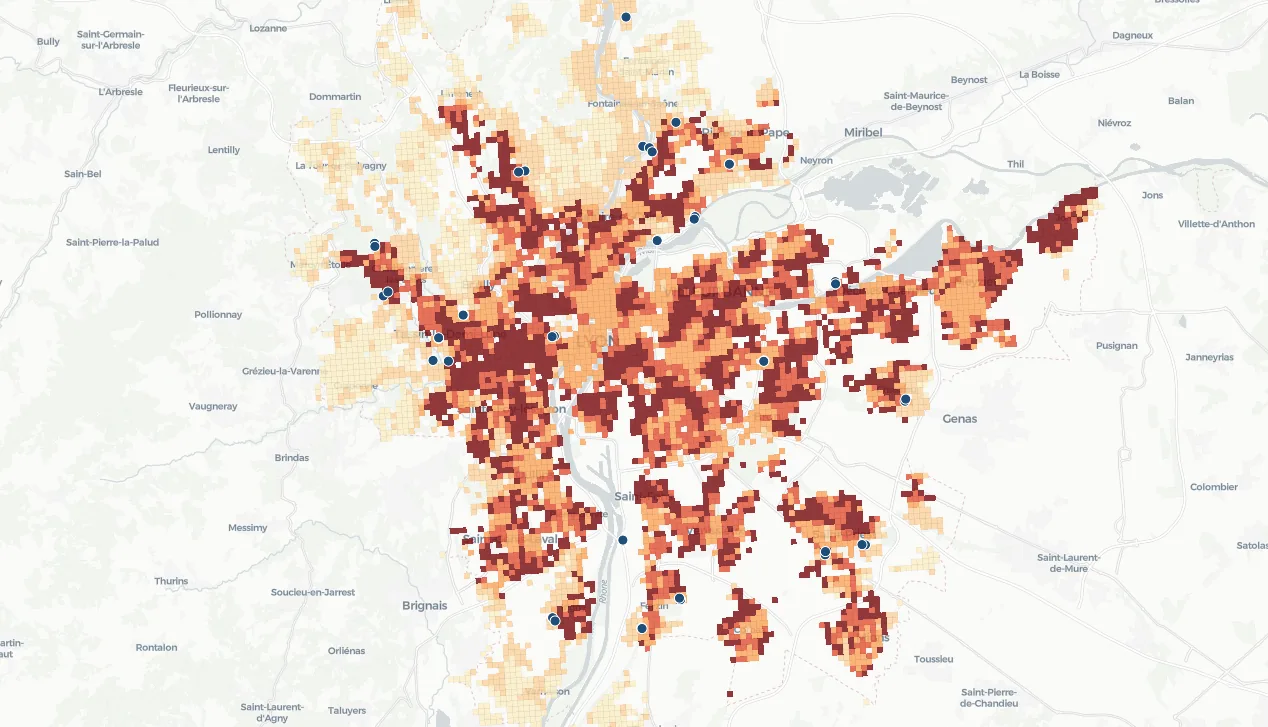
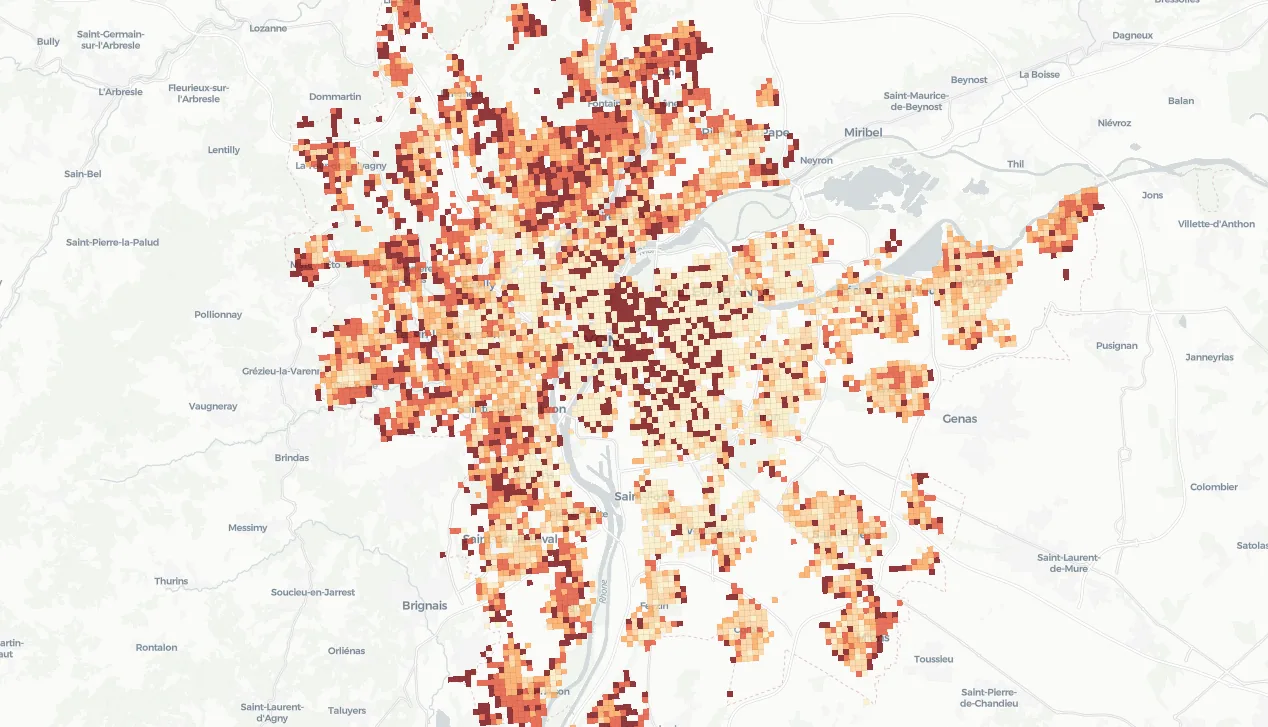
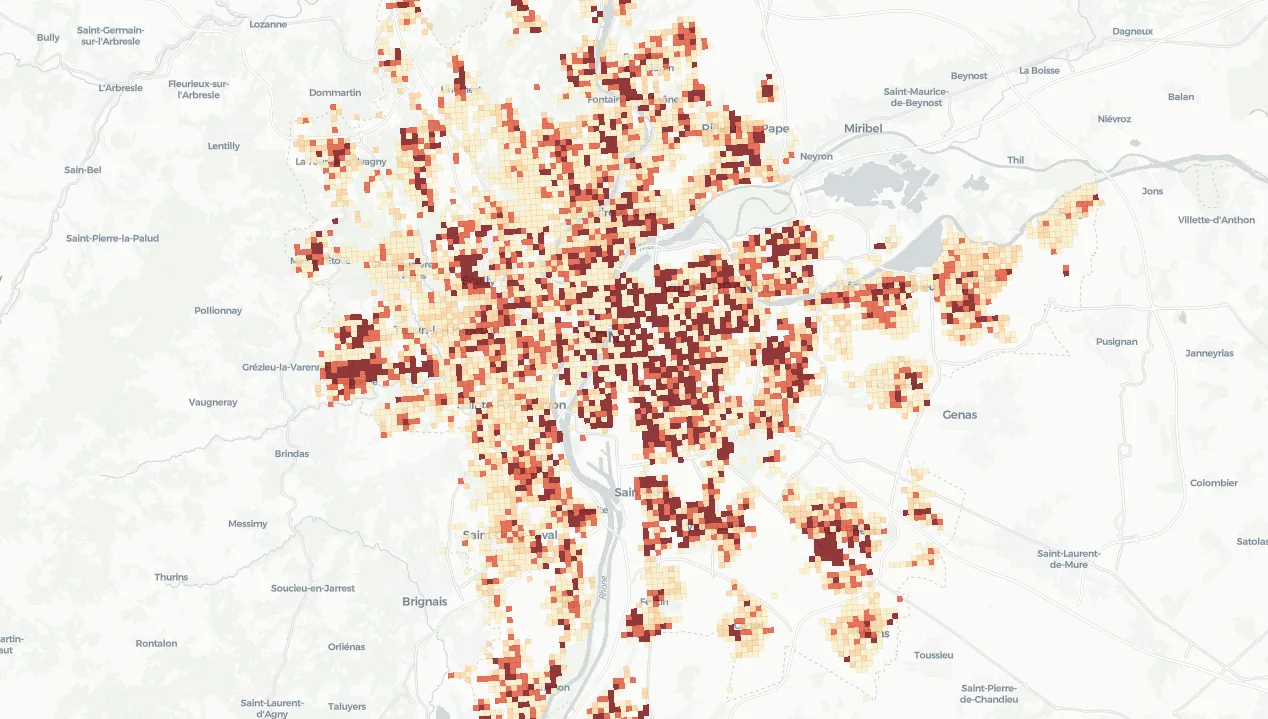
These maps illustrate how VELODIT combines spatial grids, safety signals, continuity issues and usage potential to reveal priorities that are readable and open to discussion.
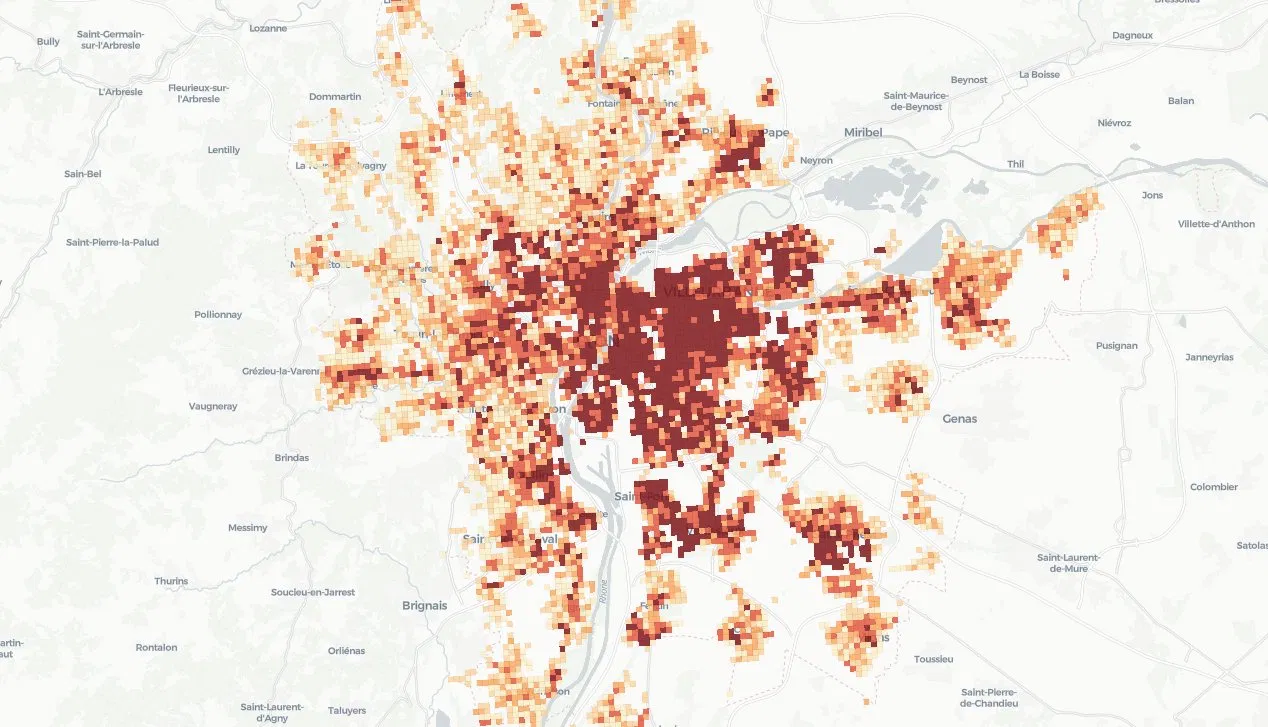
Highlights areas where needs and impact potential combine most strongly at grid-cell level.
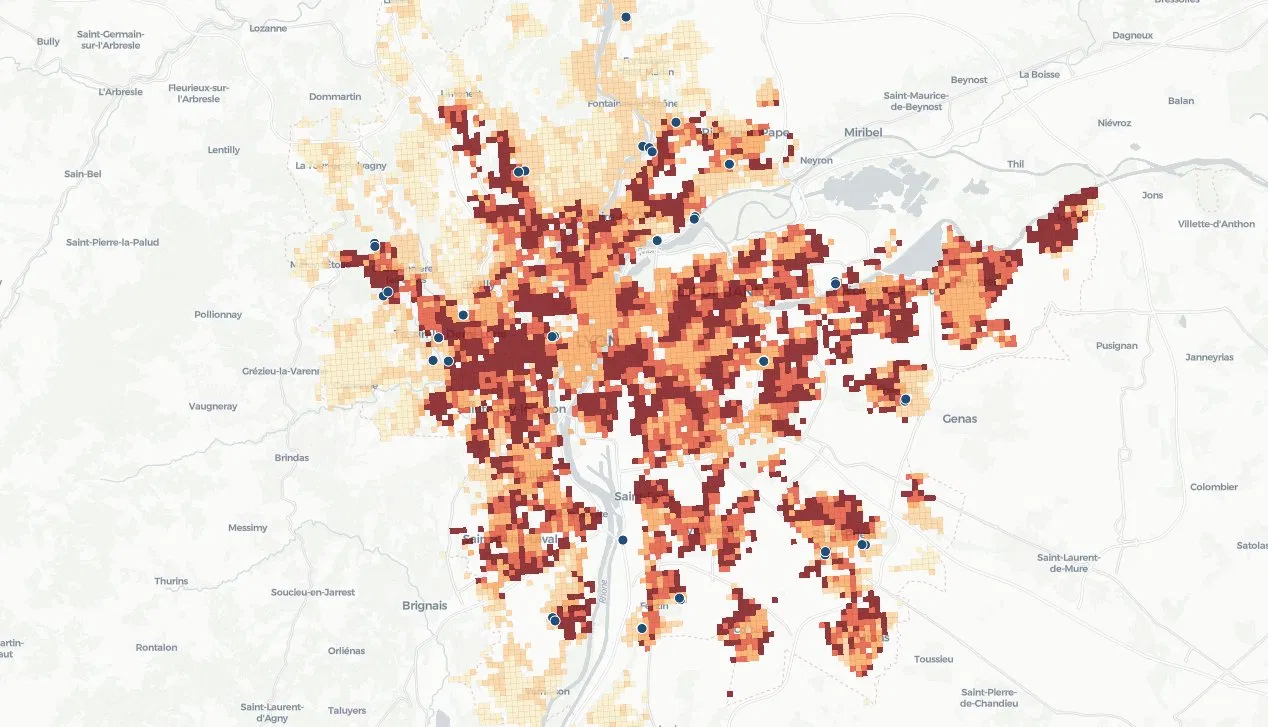
Connects spatial prioritization to concrete places, facilities and trip-generating hubs.
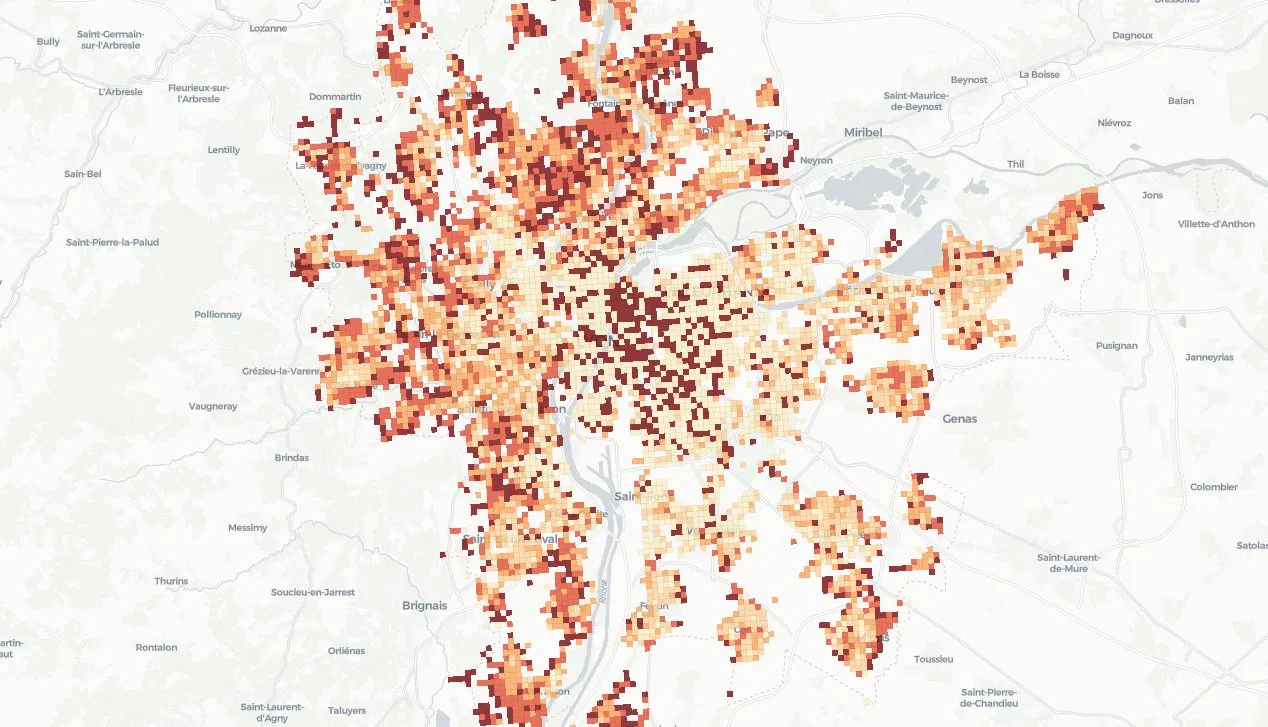
Reveals sectors where continuity and safety deficits accumulate, including outside the metropolitan core.
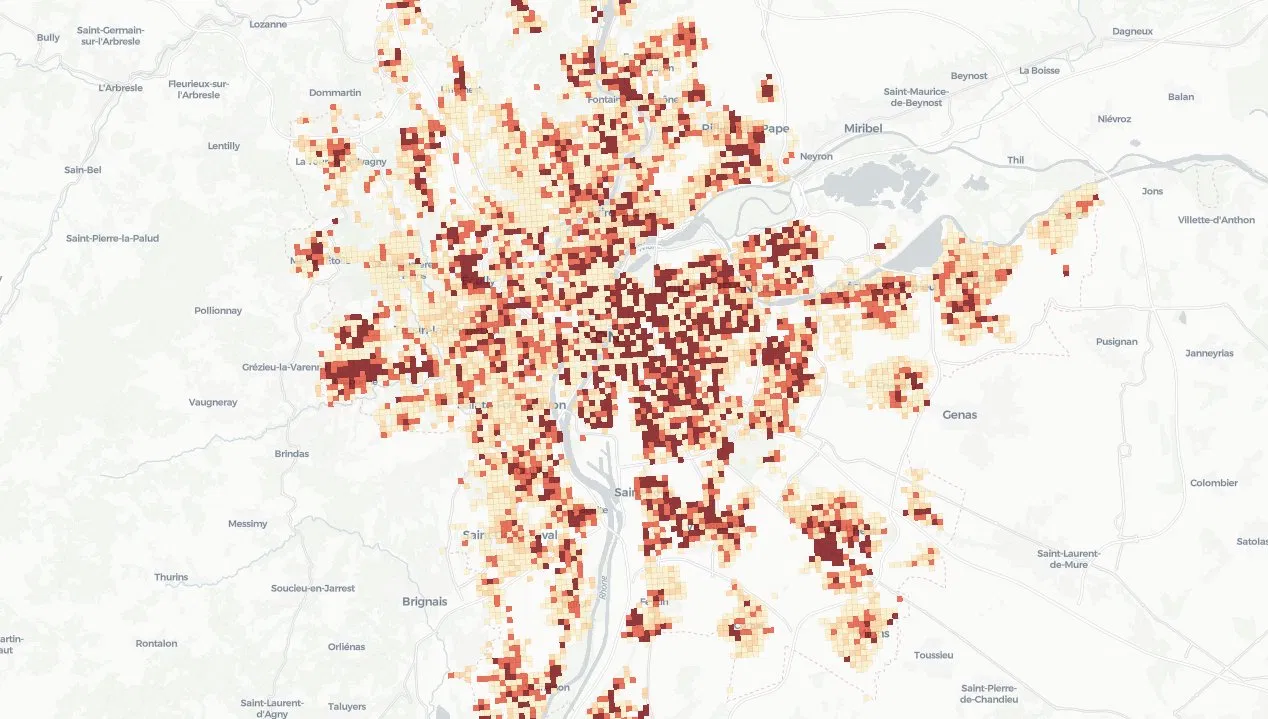
Provides a simple visual support for discussions between technical teams, decision-makers and partners.
VELODIT does not produce a single magic number. It organizes several spatial readings into a support that can be discussed and adjusted.
Combine multiple indicators at grid-cell level.
Identify abnormal crash exposure and safety issues.
Highlight missing connections with high leverage.
Produce maps and priorities that are readable by non-specialists.
The solution can be presented, tested on a defined territory or used as a structured support for investment prioritization.
A short session to understand outputs, assumptions and data requirements.
Run the method on a defined territory using available data.
Use the maps and scoring outputs in technical and political discussions.
A first exchange can clarify the available data, the geographical perimeter and the expected decision process.